

“How Investors Can Spot the Next Growth Move (With the Ansoff Matrix)”
Most investors rely on numbers like revenue growth, ROE, or profits—but these only show the past. The Ansoff Matrix is a proven framework that reveals whether a business is expanding through market penetration, product development, market development, or diversification. In this blog, we use real indian examples like Jio, Amul, D-Mart, and ITC to show how investors can look beyond numbers, spot hidden opportunities, and avoid value traps.
Arya H Parekh
9/15/20259 min read
💡 “Have you ever thought about applying a marketing strategy framework like the Ansoff Matrix to investing?
Strange right ? I also thought so.
Most people see investing as purely about numbers—Balance sheets, P&L, Financial ratios, and stock prices. But in reality, successful investing goes beyond the financials. It’s also about understanding how companies strategize, manage execution, and position their products in the market. By looking at a business through the lens of the Ansoff Matrix, investors can gain deeper insights into how growth strategies translate into margins, profitability, and long-term success.
Originally developed as a marketing framework, the Ansoff Matrix guided companies on how to grow through products and markets. But for investors, its value goes far beyond marketing. A great business is not built on revenue and profit numbers alone—it stands on the combined strength of its strategy, operations, human resources, financial discipline, and, above all, management execution.
Every successful investor whether its Raamdeo Agrawal or Warren Buffett —saw companies not merely as stocks, but as real businesses. To apply the Ansoff Matrix as an investor, you must dig deeper into questions such as:
How is the company positioning and marketing its products? (Marketing)
How efficiently is it running its supply chain and operations? (Operations)
Does it have the right talent and culture to sustain growth? (Human Resources)
And most importantly, how wisely is management allocating capital? (Finance)
If you want to be a successful investor, you cannot rely only on financial numbers. You must also examine the products companies offer and the strategies they follow, no matter the field—whether marketing, finance, operations, or HR.looks deeper—into how companies plan to grow, how they manage risks, and how they aim to increase profits. One of the most practical tools to analyze a company’s growth strategy and how company can expand then Ansoff Matrix can helps.
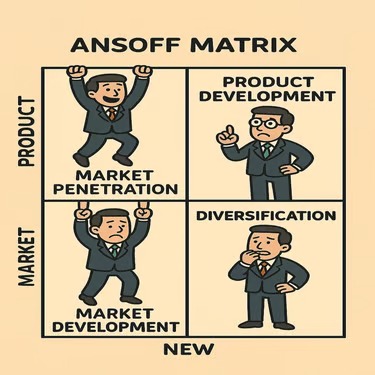
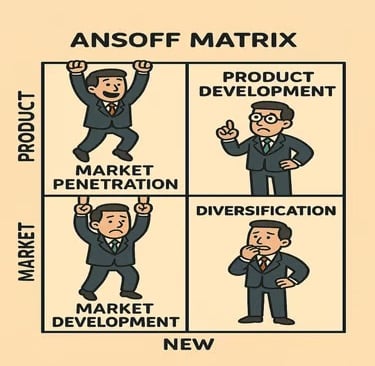
What is the Ansoff Matrix ?
The Ansoff Matrix, created by IGOR ANSOFF in 1957, is a simple tool that helps businesses and investors understand how a company can grow.
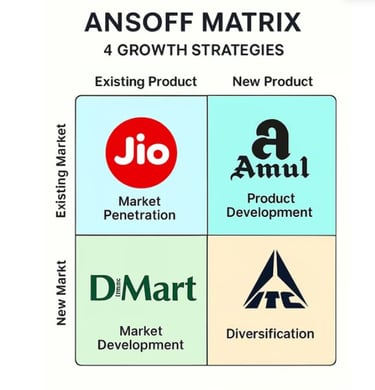
So there are four strategies in ansoff matrix—Market Penetration, Market Development, Product Development, and Diversification—based on using existing or new products in existing or new markets.
By analyzing these strategies, investors can better predict the future value of a company, understand its position within the industry, and assess whether it has or will develop a competitive advantage (MOAT). They can also determine if the company is likely to achieve margin expansion. The Ansoff Matrix not only identifies potential growth opportunities but also reflects the management’s capability and execution strength in translating strategic initiatives into long-term, sustainable results.
For investors, this framework is not just another version of the Ansoff Matrix. It helps them understand the company’s future plans, look at the risks involved, and figure out if the strategy chosen will help the company grow its profits and improve margins over time. So whenever you sees growth in revenue, ask yourself -
1st- Are they focusing on Existing products or new products?
2nd -Are they targeting Existing markets or new markets?
“Let’s understand the Ansoff Matrix through real-life Indian examples and see how different companies fit into each strategy.”
1. Market Penetration : Existing Market, Existing Product
This strategy focuses on boosting sales by reaching more customers or encouraging existing ones to buy more—without changing the product or entering new markets. It’s often seen as the safest path for growth because the company already knows its customers, distribution, and competitive landscape.
in this growth stratgy,comapany more focuses on reaching out more customers or encouraging existing contacts to purchase without developing new products or entering into new markets.
Reliance Jio entered the telecom market by offering free calls and extremely low-cost data—a classic loss-leading strategy. This helped them quickly attract millions of customers and disrupt competitors. Once they built a massive subscriber base, Jio gradually increased prices, but customers stayed because of the established ecosystem and habit of using Jio’s services
2.Product Development : Existing Market, New Products
In this strategy, companies focus on creating new products or improving existing ones to better serve their current customers. This allows them to grow without having to enter new markets or attract entirely new customer groups. Many brands also use product launches to create FOMO (Fear Of Missing Out), encouraging customers to upgrade or try new offerings.
Example – Apple, Gucci, Armani
In Indian context, Amul has been very successful in product development.
Amul constantly launches new dairy-based products for its existing customer base. For example, it started with milk and butter but later introduced ice creams, cheese, chocolates, probiotic drinks, flavored milk, and sweets. By innovating within dairy and related categories, Amul caters to changing consumer tastes while retaining its loyal customer base. This strategy has allowed Amul to expand revenue streams, strengthen brand recall, and defend its leadership in the Indian dairy market
Here, companies expand by introducing their current products or services into new regions, customer segments, or industries. It’s riskier than market penetration but can unlock significant growth if done strategically.
Example – Dmart
3.Market Development: Existing Product, New Market
D-Mart began in Maharashtra but steadily expanded into states like Gujarat, Karnataka, Telangana, and Tamil Nadu. Its core model—discount retailing of groceries and essentials—remained the same, but it adapted assortments to local needs. Unlike Big Bazaar, which expanded aggressively through rented properties, D-Mart followed a steady expansion method by owning most of its stores, ensuring cost control and long-term stability. This disciplined approach helped it widen its customer base sustainably while becoming one of India’s strongest retail chains.
4.Diversification : New Products, New Markets
Diversification has historically been one of the major causes of value destruction, as management often misallocates capital into unrelated industries or pursues random acquisitions. It is considered one of the riskiest strategies in the Ansoff Matrix and can easily turn into a value trap for investors if not executed with strong synergies and discipline.
Example – ITC LTD
ITC is a classic example of unrelated diversification. While it dominates the cigarette business, it expanded into hotels, FMCG, paperboards, and agri-business—industries that had little synergy with its core tobacco operations. This broad diversification has often turned ITC into a value trap, as capital gets locked in lower-return businesses compared to cigarettes. ITC’s case highlights how unrelated diversification can hinder the unlocking of shareholder value.
How to Analyze a Company’s Growth Strategy Through Ansoff Matrix ?
When investing long term, we usually track revenue growth, profit growth, ROE, and ROCE. But this only reflects the past. The real question for a thoughtful investor is: Where is the company going next ? Growth strategies reveal how a business plans to expand—and understanding these strategies helps you predict future profits, risks, and sustainability.
Over the years, the best investors don’t guess where a company is heading—they study its strategy using structured tools like the Ansoff Matrix. This framework divides growth opportunities into four clear paths, helping you spot whether a company is prepared for steady, compounding success or chasing short-term hype.
Let's see how we can analyse any company by checking where it stands in the Ansoff Matrix by seeing what signals to look for before investing through our given examples -
i) Market Penetration
Let’s use Jio to see how market penetration showed up in numbers:
Volume/Subscriber Growth – unit sales going up without major product innovations (classic penetration sign).
Launched in 2016 with free voice and cheap data.
Added over 100 million subscribers in just 170 days (fastest ever in telecom).
This surge showed penetration into the existing telecom market.
Revenue Growth Above Industry Average - shows the company is capturing competitors’ customers in the same market.
Like in FY17–FY20: Jio’s revenue grew at 100%+ CAGR, while incumbents (Airtel, Vodafone) saw flat or negative growth.
A clear sign Jio was capturing market share, not creating a new market.
Heavy Discounts or Promotions in Early Stages – often seen in margin compression (falling gross/EBIT margins initially)
Initially, margins were compressed due to freebies.
Later, as subscriber base stabilized, Jio raised tariffs → EBITDA margins expanded to ~40%+ by FY21
Growth Potential:
If executed well, this strategy builds stable, low-risk growth as customers become more engaged, and operations scale without heavy investments in new products or markets.
ii) Product Development
Here are the signs in numbers that show Amul’s product development strategy which focuses on creating new products or improving existing ones to meet evolving customer needs without changing the customer base.
Check Revenue Contribution from New Products
Amul started with milk & butter but now 40–45% of revenue comes from value-added products (cheese, ice cream, chocolates, beverages, sweets, etc.).
This shift shows successful product diversification within dairy,this indicates product development drives higher growth than core milk.
Margins expansion through Brand Extensions
Amul has entered adjacent categories like Amul Kool, Amul Ice Cream Parlours, Amul Mithai.
Value-added products carry higher margins than liquid milk, improving overall profitability.
This shows product development is not just revenue accretive but margin accretive.
R&D and Product Launches
Check whether how % of Revenue company spend on R&d.
Frequency of launches is a strong metric of product development.
Amul launches 100+ new products every year (e.g., Camel milk, Lactose-free milk, Protein-rich beverages, Mithai range).
Growth Potential and Risk:
Product development can increase customer value and help protect market share, especially when backed by strong brands and loyal customers. But as investors, we should ask: is the company innovating for growth, or just to survive? If a business must constantly create new products to stay relevant, it may not have a strong moat. The best businesses are those whose products and services stay in demand without relying too heavily on R&D. This doesn’t mean R&D is bad—it’s healthy for growth—but a company that needs it just to survive can be risky and better to avoid that kind of businesses.
iii) Market Development
Here, companies introduce new products or enhance existing ones to meet evolving customer needs in familiar markets. Innovation, not expansion, is the driver of growth.
Geographic Expansion (seen through revenue growth from new regions)
Entering new states, regions, or countries while selling the same product- D-Mart expanding from Maharashtra to South India. FY2011: ~25 stores (mostly in Maharashtra & Gujarat). FY2024: 371 stores across 12 states.
D-Mart’s expansion beyond Maharashtra has been a key growth driver: in FY2014, nearly 60% of its revenue came from Maharashtra, but by FY2024, over 45% came from other states as it entered Gujarat, Karnataka, Telangana, Tamil Nadu, and more. This steady rise in contribution from new regions shows the impact of market development on revenue growth.
Sign → steady entry into new states with the same discount retail model. (Sometimes disclosed as “regional revenue split.)
Capex in New Locations - Rising Store/Branch/Outlet Count
High capital spending on land, stores, warehouses, or distribution centers in new geographies.
D-Mart pursued a steady expansion strategy by owning land and buildings.Unlike Big Bazaar (rented properties, rapid rollout).
Sign → slower but more sustainable market entry with stronger cost control. (Often shown in annual reports as “store count” or “geographic footprint.”)
Same Product Mix, Different Markets
No major change in core offerings → confirms it’s market development, not product development.Core focus still on groceries, FMCG, and daily essentials- No major deviation in product mix
Growth Potential:
Product development deepens customer relationships, increases lifetime value, and creates long-term pricing power, helping the company grow steadily without constantly seeking new customers.
iv) Diversification
This is the most high-risk strategy in the Ansoff Matrix, and ITC is a classic case. Despite owning one of the most profitable cigarette businesses in India with consistently 25%+ ROE over the last 10 years, the company has delivered only about 8% CAGR returns to shareholders. The reason? Diversification into unrelated, low-return businesses.
Misallocation of Capital – Instead of compounding shareholder wealth by reinvesting in its high-ROCE core, ITC has channeled funds into low-ROCE segments like FMCG and hotels.
Unnecessary Acquisitions – Several acquisitions lacked clear synergies and added little value. Example - Easemytrip has been chasing too many unrelated acquisitions at very high valuations, due to which stock has already fallen more than 70% from its top, destroying shareholder's wealth.
Expansion into Unrelated Industries – By entering businesses far removed from its core, ITC diluted focus and
management bandwidth.
Investor Impact:
This mismatch shows how even a high-ROE business can fail to create wealth if capital is diverted poorly. Unrelated diversification has trapped ITC’s value and risks destroying shareholder wealth further. For long-term investors, such companies are best avoided unless they demonstrate disciplined capital allocation.
Conclusion : Investing Beyond Numbers
The Ansoff Matrix isn’t just a theoretical tool: it’s a practical way to decode how companies grow and whether they’re set up for long-term success. From this we can learned that identifying which strategy a company follows—and how well it’s executing it—can reveal opportunities others miss.
When analyzing a potential investment, ask:
Which quadrant of the Ansoff Matrix is this company in?
Is it making smart moves or blindly chasing growth?
Do its customers, leadership, and financials align with its strategy?
Master these questions, and you’ll be better equipped to invest in companies that not only perform well today but are prepared to thrive for years to come.
This blog helps investors spot how companies grow using the Ansoff Matrix . By understanding each segment of the matrix, investors can see whether a business is focusing on existing products, exploring new ones, entering fresh markets, or innovating entirely.This perspective helps you look beyond just the numbers and financial ratios. It allows you to evaluate the company’s product strategy, execution capability, and long-term vision—critical factors that often determine sustainable success.Stay informed and invest wisely!


Investing & Finance
Develop the Right mindset of investing in the indian stock market from the masters.
Join our Master Investor Community and develop the Right mindset of investing
Subscribe
contact - arya@masterinvesting.in
© 2025. All rights reserved.